Property Market Update August 2021
Australian property has its best year since 2004. It’s not often we see double-digit annual growth in property prices for all capital cities and regional areas around Australia.
Property Market Update August 2021
Australian property has its best year since 2004.
It’s not often we see double-digit annual growth in property prices for all capital cities and regional areas around Australia. But in the 12 months to 31 July, dwelling prices across the country rose by an average of 16.1% – the biggest annual gain since February 20041.
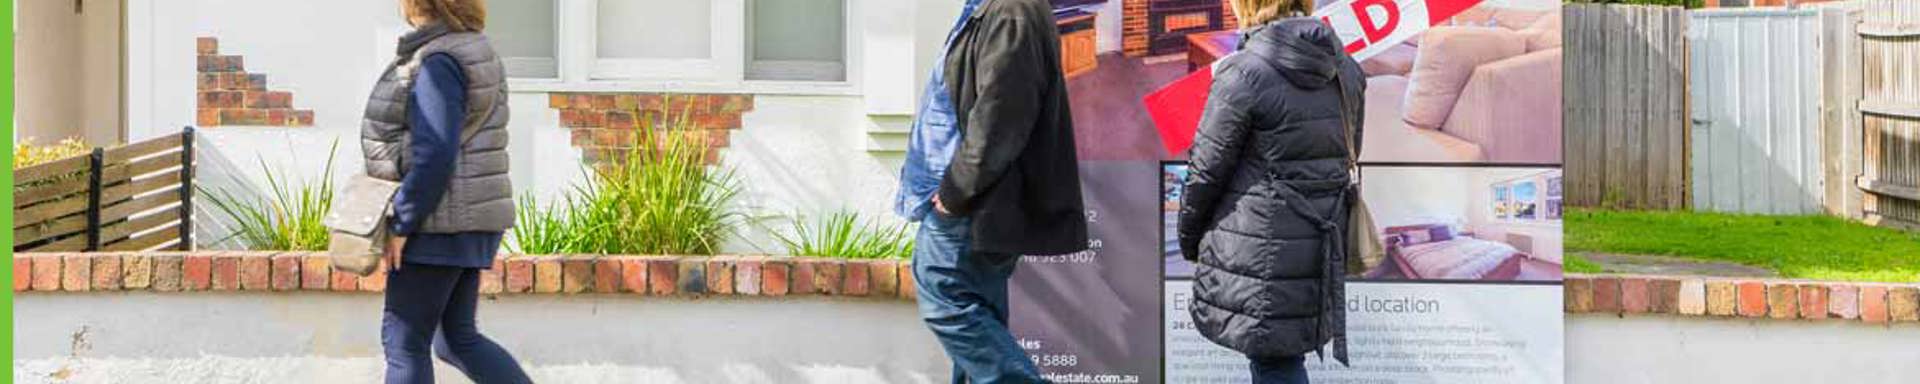
In the 3 months to July 31 alone, dwelling prices rose by 6.0% in our capital cities and 5.7% in our regional areas1. That jump was partly driven by strong auction clearance rates (75.7% for our capitals in the June quarter2) and continued low stock levels (26% below the five-year average3).
What’s particularly remarkable about this growth is that it happened despite numerous COVID-related lockdowns, including an extended one in Sydney.
Now that spring is here, it will be interesting to see what impact potential lockdowns have on sentiment and property market performance next quarter and beyond. Watch this space!
Median dwelling (house/unit) prices at 31 July 20211
| City | Median dwelling price (house and units) | Capital growth last 12 months |
|---|---|---|
| Sydney | $1,017,692 | 18.2% |
| Melbourne | $762,068 | 10.4% |
| Brisbane | $598,615 | 15.9% |
| Adelaide | $516,454 | 15.7% |
| Perth | $532,392 | 10.8% |
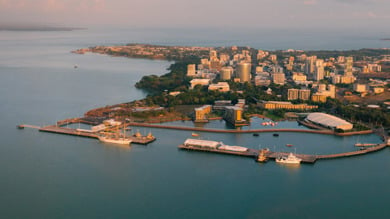
| Darwin | $486,054 | 23.4% |
| Hobart | $621,102 | 21.9% |
| Canberra | $793,872 | 20.5% |
| Combined capitals | $740,475 | 15.1% |
1 CoreLogic Home Loan Value Index, 2 August 2021